MySOYL enables the most comprehensive analysis of farm data ever
Precision farming market leader, SOYL has launched its most ambitious version of MySOYL to date.
MySOYL is SOYL’s web-based management tool which enables growers to view and analyse their precision data and use it to make business decisions. MySOYL is accessed through parent company Frontier Agriculture’s MyFarm online platform.
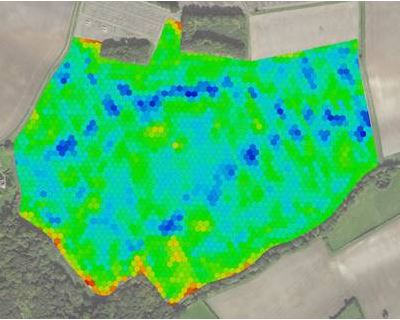
The latest MySOYL update provides a range of benefits, made possible by new measurement tools and the analysis of data using a grid made up of hexagons. This allows much better visualisation of field performance, as each data point now joins six times in multiple directions (as opposed to the four times in two directions offered by other software on the market) and is mapped every 15 metres.
This use of hexagons is a global first, giving the best available resolution of field data on the market and the most intuitive view of yield performance.
In brief this update delivers the following:
- Improved yield insight – the ability to view multiple layers of data and identify/interrogate trends
- Better resolution of data – improved visual representation of a farm’s performance
- The ability to drill down into multiple layers of data and view all areas within a section of land based on specific parameters e.g. above or below a set yield
- From March, access to weekly variable biomass images during the season, which can be included as a layer of data.
“There are lots of additional subtle tweaks under the hood to make the application even better, not least access to variable rate nitrogen images using the variable rate nitrogen tool. However, what’s really exciting is a brand new way to visualise field, farm and business performance. The primary output of any farm is the crop and insight into the yield of that crop is crucial to the financial stability and ultimately sustainability of that business.”
This specific functionality has been developed in conjunction with feedback from Frontier Agriculture’s team of 140 agronomists who use SOYL’s services to help support growers. Nigel Foster, regional agronomy manager for Frontier in Yorkshire and an expert in digital agronomy explains, “Our agronomists make use of SOYL’s satellite imagery, soil zones and scouting app to help make better agronomic decisions. These new MySOYL features will help us better understand and interpret yield map data which is something our agronomy clients have been asking for.”
New insight tool
The insight tool allows further analysis beyond just the visual to show the distribution of yield across a field.Now, users can delve into statistics behind the maps and view historic yield reports or P&K maps.
Users can also edit a yield map by inputting the actual overall yield of a field. This will be redistributed pro rata according to data in the system; for instance actual yield taken from a weighbridge.
Setting parameters to identify patterns & make plans
It can be very useful to identify areas of land that are performing in a particular way; be they high or low yielding and MySOYL can now be used to document this too. For example, if it is known what the break-even yield point was for a particular year, the user can set that within MySOYL and identify all areas that either exceeded or fell below that point.
It’s easy to see how this can help to highlight areas that could be earmarked for environmental schemes, areas that are ‘propping up’ the margin or areas that need further investigation/remedial attention.
“We have many farmers already using the new tools and feedback has been really positive. As we move into the growing season and nitrogen maps also become available we expect that number of users to grow significantly. Being able to quantify farm performance using MySOYL is powerful but you really need to try it on your farm to see how this can change management decisions within your business,” concludes Tom.
Value for money
Any farmer with yield maps can access MySOYL and all of its new functionality for just £350/year. This includes the cleaning and processing of a grower’s yield data back-catalogue, as well as the analysis and visualisation features.
To learn more about any of SOYL’s services including MySOYL call 01635 204190 or email This email address is being protected from spambots. You need JavaScript enabled to view it.