MySOYL gives you the ability to view multiple layers of data side by side. This allows for an easy, visual comparison of fields and the flexibility to construct the screen to suit your individual requirements.
Use the button in the left hand tool bar to control the screen setup:
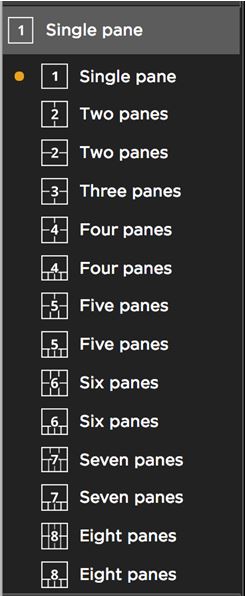
The icon gives you a preview of what the screen will look like. So if you want to display four data layers - for example, P, K, Mg, pH then use one of the four view options, either as equal screens or as one main with four thumbnails. Incidentally, the latter is the way to see the legend of a nutrient map!
The layers are controlled by the dropdown in the top of the view pane.

Together with the year to which the data layer refers, the nutrient layers will be the same for four years and then be different for the next 4 years and so forth.
You can display up to eight different layers at a time - a mixture of layers of various years of the same layer, such as yield data.

Use the 'Layer inspector' to view the underlying values of all of the displayed layers, regardless of which pane you click on.

For further assistance, please call the SOYL team on 01635 204190 or email This email address is being protected from spambots. You need JavaScript enabled to view it..
- Home

- Resources
- MySOYL Tips & Tricks
- Viewing Data
- Viewing multiple layers of data
Viewing multiple layers of data